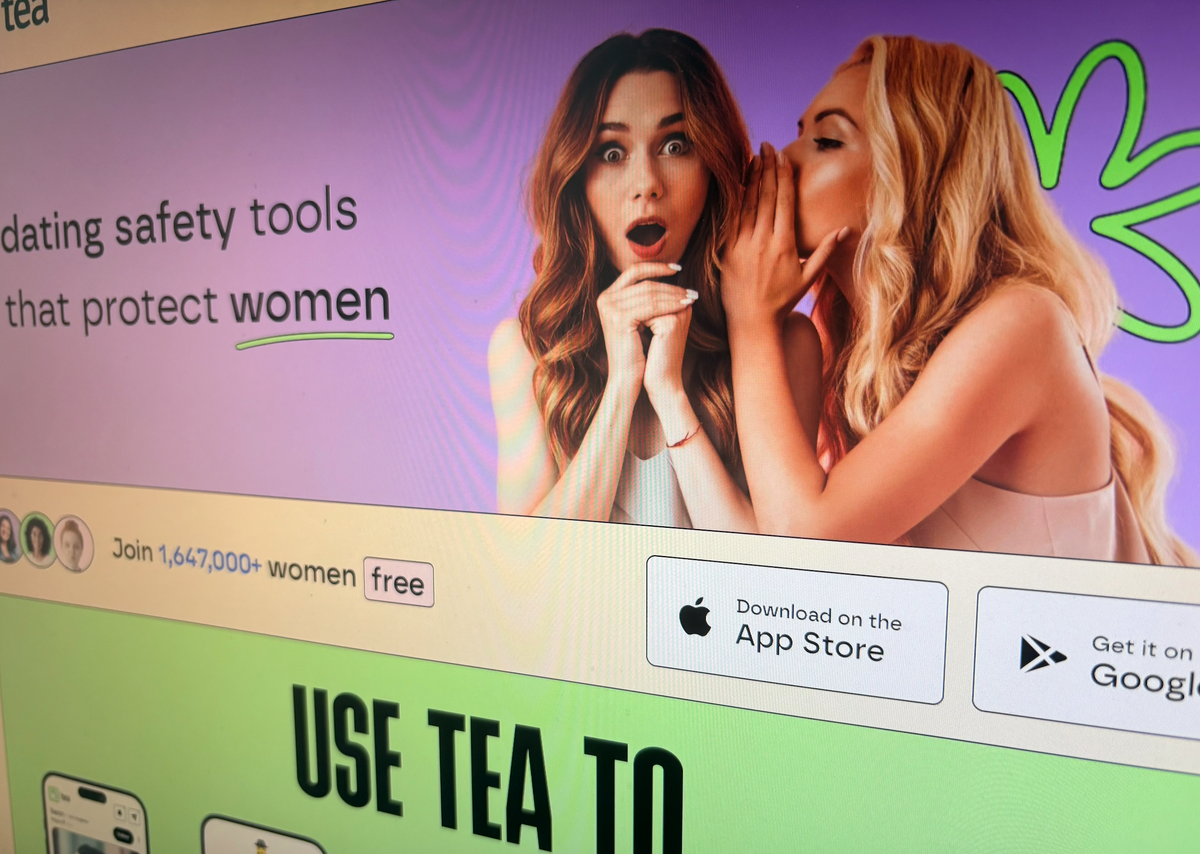
Users from 4chan claim to have discovered an exposed database hosted on Google’s mobile app development platform, Firebase, belonging to the newly popular women’s dating safety app Tea. Users say they are rifling through peoples’ personal data and selfies uploaded to the app, and then posting that data online, according to screenshots, 4chan posts, and code reviewed by 404 Media.


This is a valid take but also consider that the “average man” in the USA is more likely to be a Trump voter or non-voter than someone who would vote to protect women’s rights. Over half of men voters vote for Republican Presidental candidates consistently. On the flip side men supporting Democrat Presidential candidates mostly clocks in at just above 40%. When you account for the size of the USA, those differences are pretty big and put arguably awful men in the clear majority.
I’d love to see where you got your stats, because it looks like you may have cherry-picked a specific group of men for that 60/40 split. The overall split for men in 2024 was closer to 52/46 Republican/Democrat. 52% is still obviously above 50%, but a 6% split between the two is nowhere near the ~20% split you listed. Some specific demographics of men come close to that 60/40 split, but that says more about those specific demographics. For instance, married men swing harder right, but married women do too.
https://cawp.rutgers.edu/blog/gender-differences-2024-presidential-vote
This is for all men and women, not broken down by different factors.
When an average is taken of all the elections, men average 43.67% for Democrat and 50% for Republican for a 6.33% difference. I do also think it’s notable that in only one election since 2000 has the support for Republican candidates from men been under 50%, that’s 48% for McCain in 2008. I honestly think the voting patterns from the 90’s are gone and so while I included those in the averages, I think just touching on votes since 2000 gives a clearer picture with the average for men supporting the Democratic candidate at 44.14% and support for the Republican candidate at 52.58% for an 8.44% difference. That’s still a large spread when we’re talking the total number of men who vote at all. Somewhere around the size of the entire city of Los Angeles in terms of population.
I mean…
Looking at mic_check’s figures…
Lets say we are just talking straight, hetero people.
We got all straight men at 43:55 Dem to Rep, thats a 22% higher chance of a woman randomly picking a Rep instead of a Dem.
Meanwhile you can just, as a woman who is looking into dating a man…
Just pick a random, single, never married dude.
Bam!, now its 61:37 Dem to Rep, a 65% higher chance a random, never married dude will be a Dem than a Rep.
…
We are talking about these stats in the context of dating, right?
Where people like, talk, get to know each other?
Not just being randomly assigned partners from a slot machine?
Do dating apps not like, allow you to filter by something like this, or… talk/chat to a person, and ask them questions before you meet them…?
Its kind of silly to paint individual people with a broadly accurate brush… when the ostensible whole point is to get to know a person individually.
Sure, use broad stats to form a broadly accurate general worldview, but realize its limitations.